Graphs and Maps
|
|
|
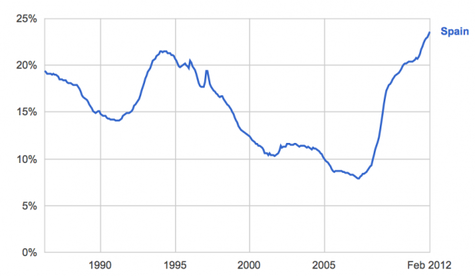
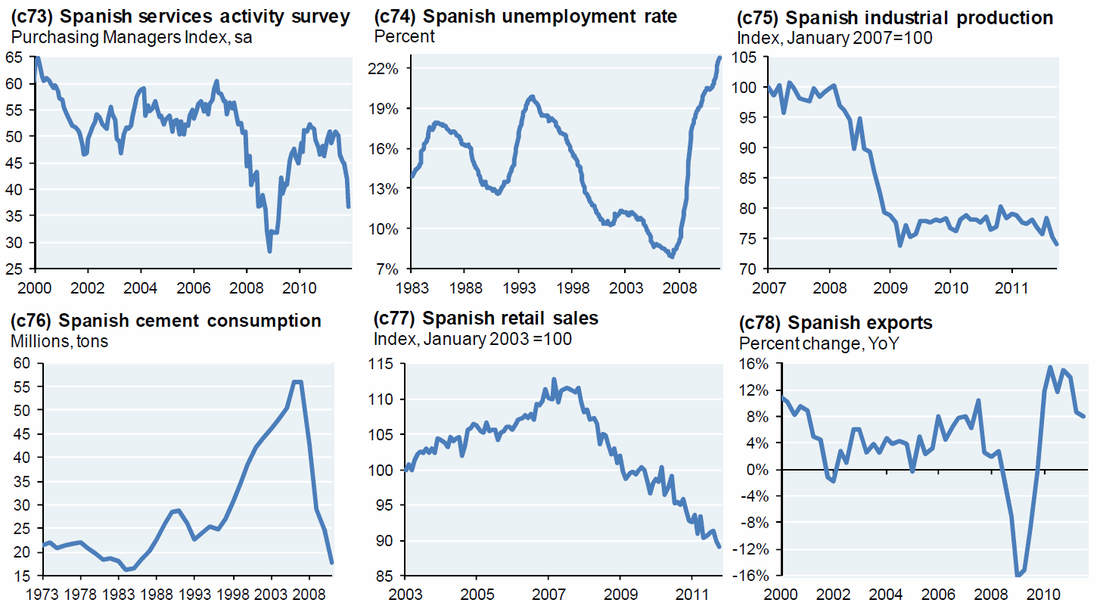
Above, a simple line graph depicts the unemployment rate of Spain, and the most important time interval is between 2007 and 2012.
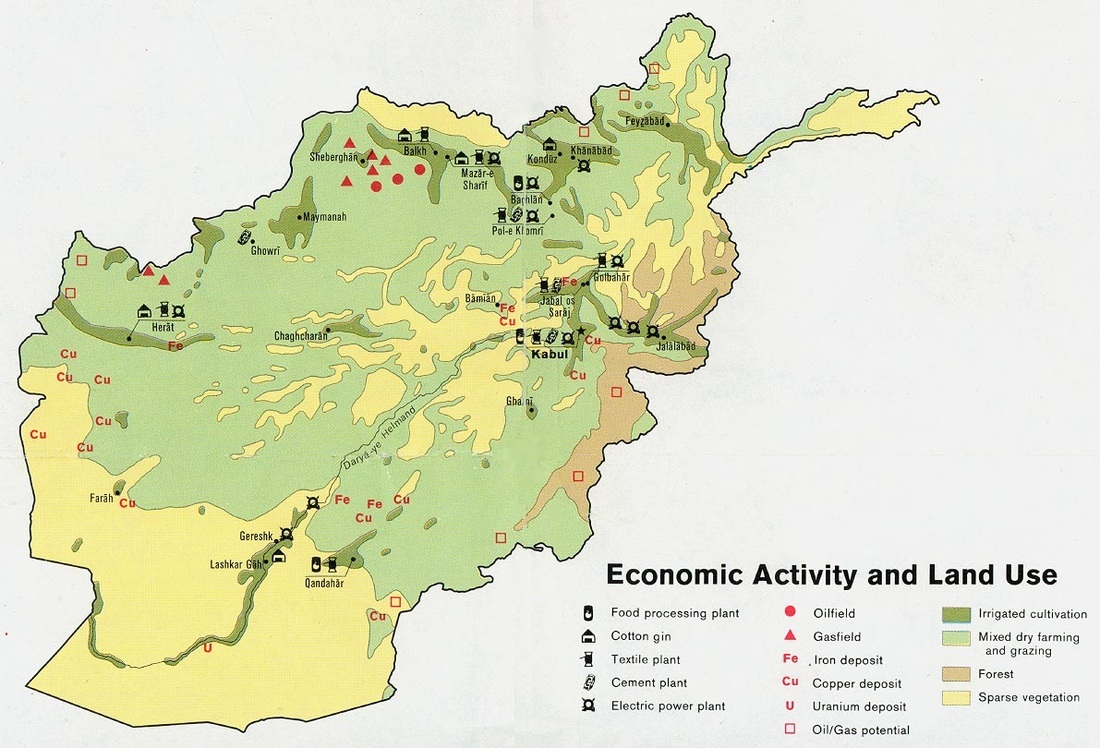
To the left, Spain is the country at the bottom left and Portugal, mostly an orange color, is attached to the left of the country. |
